How to Add a New Account in Google Analytics
Get more from Google with this guide to analytics
The world of digital analytics is changing fast. With the onset of mobile, and the rapid growth of connected devices, traditional web analytics is no longer adequate.
To meet the growing needs of businesses, Google Analytics has changed from a web analytics solution to a business measurement platform. From websites to mobile apps, and almost any other internet-connected devices, you can use Google Analytics to measure your entire business.
Where data comes from
Let's start at the beginning with how Google Analytics collects and organises data. All data is sent to Google Analytics via a data hit. Included in this request is information about the visitor and their behaviour.
Once the hit is collected, Google Analytics processes the hits about every three hours and turns them into dimensions and metrics, which are the building blocks of reports.
Dimensions represent information about your users and the sessions they create. Some common dimensions include Page Title (the title of an HTML page), the visitor's geographic location (Country, Region, City, etc), or the type of device the visitor is using (tablet, smartphone, etc).
The second type of information is metrics. Metrics are the numerical data collected by Google Analytics. Metrics can be simple integers, like the number of visitors to a website, or calculated values, like the average amount of time a visitor spends on a site.
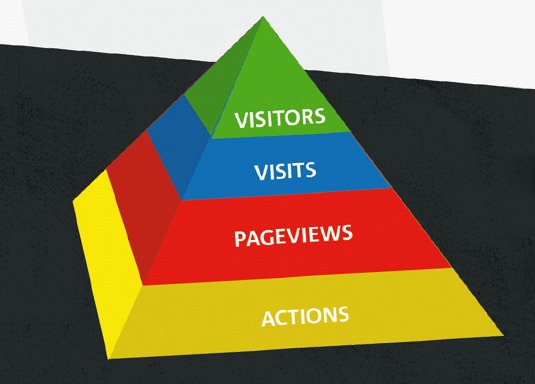
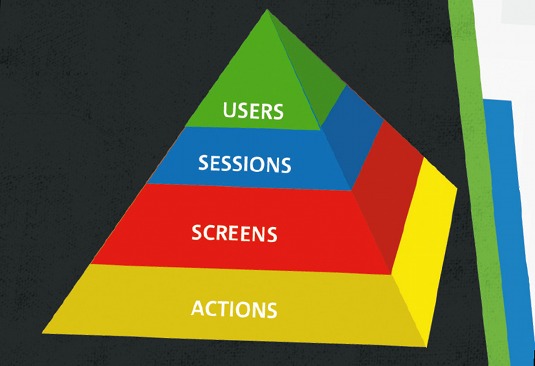
You can think about Google Analytics metrics as a hierarchy. At the top of the hierarchy you have visitors, a count of the number of people that interact with the site. Visitors create visits, which is a defined period of interaction. Within that visit are PageViews. Finally, at the bottom of the hierarchy, we have something called Actions, which are detailed interactions within pages.
There's other data as well. Some of the most important data is conversion data. Conversions represent important business actions, like completing a transaction or submitting a lead form. You measure these actions with a feature called Goals. If you're an ecommerce company, you can also measure ecommerce data including total number of transaction, products purchased and total revenue, etc.
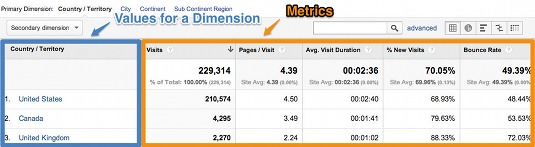
Once the data has been collected and processed, it's turned into reports. Almost all of the reports in Google Analytics are built using Dimensions and Metrics. In most cases, all the values for a single dimension are showed in a table along with metrics for each value. For example, the Countries report shows all the values for the Countries dimension along with a number of different metrics.
This is a fairly simplistic overview of how the system works. But it should give you a good foundation for some of the advanced topics that we'll discuss later. Let's move into more detail and talk about measuring a website.
Basic website implementation
To measure a website with Google Analytics, you must add a snippet of JavaScript to every page on your site. This JavaScript collects basic information, like the URL of the page the visitor is looking at or where the visitor came from (another website, search results, etc) and then automatically sends the data back to Google's collection servers via a data hit.
Here's what the basic tracking code looks like:
<!-- Google Analytics --> <script> (function(i,s,o,g,r,a,m){i['GoogleAnalyticsObject'=r;i [r]=i[r]||function(){ (i[r].q=i[r].q||[]).push(arguments)},i[r].l=1*new Date();a=s.createElement(o), m=s.getElementsByTagName(o)[0];a.async=1;a. src=g;m.parentNode.insertBefore(a,m) })(window,document,'script','//www.googleanalytics.com/analytics.js','ga'); ga('create', 'UA-XXXX-Y'); ga('send', 'pageview'); </script> <!-- End Google Analytics --> This code does a few things. First, it asynchronously loads a library named analytics.js. This library contains all the information that Google Analytics needs to operate. Then it sends an invisible image request back to Google's analytics servers. The type of hit is called a PageView. When the hit is received, the system will calculate other metrics, like visits and visitors.
Also notice the UA number in the previous code snippet. This is your account number. This is how Google Analytics connects your account to the property that's collecting the data.
This JavaScript should be placed in the <HEAD> tag on every page of your site. If you use some type of CMS, you can add the JavaScript directly to your template.
You'll get a lot of data from the standard Google Analytics page tag. But at some point you will discover that you need a more detailed measurement as well.
Measuring visitor interactions
Today's modern website is complex. Ajax, responsive design and HTML5 are quickly abstracting the traditional analytics model. Users can do many different things on a single page, almost rendering the PageView metric useless. From an analytics perspective, we need more in-page measurement to better understand user behaviour. That's where event tracking comes in.
Event tracking is a flexible data collection tool that can be used to measuring button clicks, video players or any other user interaction with content. Events count anything you want. The neat thing about event tracking is that you define the data and when it's collected.
An event has the following components:
- Category: The category is a way to group certain events together, like all of the events that happen in a video player.
- Action: The action is the actual action that a user takes. It could be clicking a button, clicking on a HTML link, or changing a setting. Almost anything.
- Label: The label provides more information about the action. For example, if your action is a Video Play Button, then the label may be the name of the video. Or, if you're measuring clicks on links, the label could simply be the URL of the link that the user clicked.
- Value: A numeric value for a particular event. This could be the number of seconds, or a score in a game. The only requirement is that it's an integer. The value actually applies to the combination of the Category, Action and Label. Google Analytics will sum the value in the reports.
So how do you generate event data? Unlike PageViews, which are automatically generated by the Google Analytics JavaScript, the event JavaScript must be placed inside your code. You need to attach them to the appropriate code that represents a user action.
For example, if you want to measure a click on a button, you could create a category called 'UserActions', an action called 'ButtonClick' and a label that is the name of the button. Use the following code to the onClick event handler:
<button id="button" onClick="ga('send', 'event', 'UserActions', 'ButtonClick', '[BUTTON NAME]');">Please click</button> When the above code executes a data hit, containing all of the event information, it's sent back to the Google Analytics collection servers.
While the previous code will work, it's always a good idea to abstract your event tracking code, and any analytics code for that matter, from the presentation layer.
Here's a very common example of abstracting the event code while also making it cross-browser compatible. This code will measure PDF downloads when a user clicks on a HTML button:
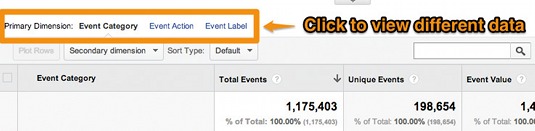
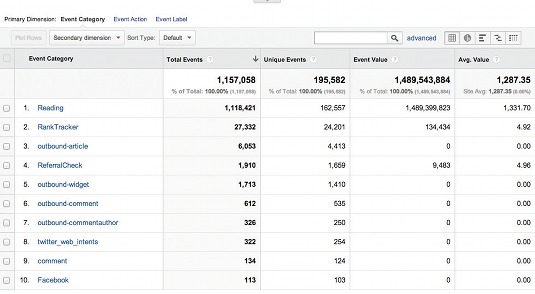
var linkClick = document.getElementById ('button');addListener(linkClick, 'click', function() { ga('send', 'event', 'UserActions', 'Button Click', '[BUTTON NAME]'); }); function addListener(element, type, callback) { if (element.addEventListener) element. addEventListener(type, callback); else if (element.attachEvent) element. attachEvent('on' + type, callback); } Now let's take a look at the data. Event data is found in the Content Reports, Events section, Top Events report. It's organised based on the Category, Action and Label values that you create in your code. Notice that, by default, you're viewing the data by category. You can switch to view the data based on Labels or Actions using the Primary Dimension links at the top of the table. You can also select an individual Category and view all the actions and labels associated with that category by clicking on a category name.
So how can you use events? Here are some of the most common reasons events are used in order to measure:
- PDF and other types of file downloads
- Clicks on links that point to other domains
- Audio players, calculators, video players
- Product configuration tools. For example, an automobile configurator
There are opportunities to use events everywhere on a website. But, before you undertake a massive implementation, make sure the data is useful and actionable.
Adding custom dimensions and metrics
Another way to customise the data in Google Analytics is through Custom Dimensions. If you've been using Google Analytics for a while, you may already be familiar with the Custom Variables features. Custom Dimensions are the new version of Custom Variables.
As the name implies, Custom Dimensions are dimensions of data that you manually create.
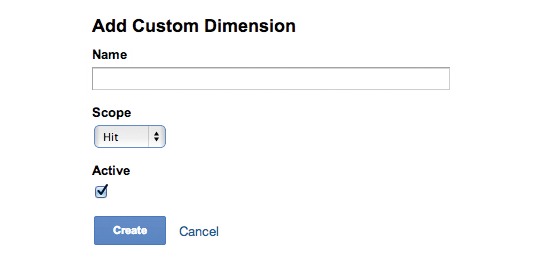
To create a Custom Dimension, you start by defining the dimension in the Google Analytics Admin section. There you name your Dimension and specify the Scope.
The Scope defines what data hits a Custom Dimension should be applied to. There are three types of scope:
- Hit: Just apply the Custom Dimension to a single hit of data
- Session: Apply the Custom Dimension to all the hits contained within a session. This would include all PageViews, events and transactions
- User: Apply the Custom Dimension to all of the hits from all of the sessions for an individual user. This is useful when you want to identify a trait of your users that will not change over time
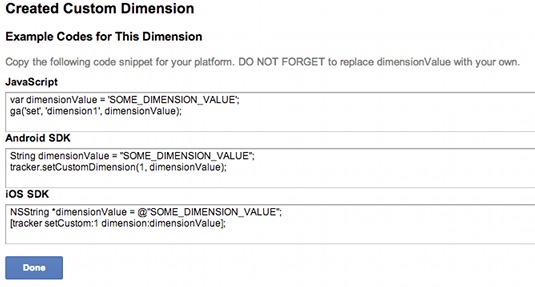
Once you create the Dimension in Google Analytics, the system will display the code you need to add to your website.
Here's the trick, Custom Dimensions can only be sent with an existing Google Analytics hit. So far in this article we've covered the most common types of hits, a PageView hit and an event hit. So, if you want to set a Custom Dimension, you must send that data with an existing hit.
For example:
ga('send', 'pageview', {'dimension15': 'Event Value'}); For instance, a few common ways to use Custom Dimensions include:
- Separating members from non-members
- Separating logged in users from non-logged in users
- Measuring repeat customers
In addition to creating Custom Dimensions, you can also create your own Custom Metrics. (See our support documentation for more details).
Measuring mobile applications
Now let's step away from measuring websites and talk about measuring mobile applications. Many people don't know that Google Analytics can measure Android and iOS apps. From a conceptual level, everything we've discussed so far, events, custom dimensions and metrics, etc, can be applied to mobile applications as well.
In general, the mobile application data model is the same as the web data model. But there are a few slight differences. For example, there aren't any visitors or PageViews in the mobile application world. Instead, there are users and screens, but the hierarchical structure of the data is still the same.
This data is collected in a similar manner to website data. It's sent to Google Analytics via a request to the Google Analytics collection servers. The primary difference between a mobile data hit and a web data hit is that the mobile hit isn't created using JavaScript code. Instead Google Analytics provides a SDK for both Android and iOS to generate the data hits.
From an implementation perspective, it's a bit different to implement app tracking. Unlike a website where you just add some code to the site and you instantly have data, you need to integrate the app tracking code within the app. The exact integration depends on the platform.
One measurement concept specific to mobile apps is dispatching hits. Unlike the JavaScript tracking code, which sends hits immediately to Google Analytics, mobile apps queue the hits prior to sending them. This feature is designed to mitigate the challenges of unreliable network access and limited battery life.
By default, Google Analytics will send the queued hits every two minutes. But you can control the periodic dispatch using the following code (iOS):
[[GAI sharedInstance] setDispatchPeriod:60]; In Android, the default dispatch is 30 minutes. But, like iOS, you can customise the interval code by using the following:
GAServiceManager.getInstance(). setDispatchPeriod(60); In addition to standard data, you can also measure information that's specific to the app world, like app crashes and exemptions. This information is particularly useful as you look to improve app performance and the user experience. It only takes a single line of code to collect this information. In Android, the code would look something like this:
<bool name="ga reportUncaughtExceptions" >true</bool> And, in iOS, expect the code to look something like this:
[GAI sharedInstance].trackUncaughtExceptions = YES; Wrapping up
Hopefully, we've been able to broaden your perspective of what's possible with Google Analytics. It's important to remember that, in order to be actionable, data needs to relate directly to business strategies and tactics. Using the full breadth of features that are available in Google Analytics, you'll be able to better align your data with your business.
Words: Justin Cutroni
Justin Cutroni is a blogger, author and the analytics advocate at Google. He's responsible for user and community education and global enthusiasm surrounding digital analytics. He publishes the blog Analytics Talk and has authored or co-authored three books about Google Analytics.
This article originally appeared in net magazine issue 244.
Liked this? Read these!
- Brilliant Wordpress tutorial selection
- Our favourite web fonts - and they don't cost a penny
- Excellent examples of landing page design
Got a question about Google Analytics? Ask in the comments!
Related articles
How to Add a New Account in Google Analytics
Source: https://www.creativebloq.com/web-design/googles-guide-analytics-11135339